How to install Ntopng (Network Monitoring Tool)
Ntop is a network traffic tools that shows real time network usage on your server. You can use a web browser to manage and navigate through ntop traffic information to better understand network status.
Ntop monitors and reports hosts traffic and supports these protocols:
- TCP/UDP/ICMP
- (R)ARP
- IPX
- DLC
- Decnet
- AppleTalk
- Netbios
- TCP/UDP
ntopng is the next generation version of the original ntop. It is based on libpcap and it has been written in a portable way in order to virtually run on every Unix platform, MacOSX and on Win32 as well.
What all things Ntopng can do:
- Sort the network traffic according to many criteria including IP address, port, L7 protocol, throughput, AS.
- Show the network traffic and IPv4/v6 active hosts.
- Produce the long-term reports about various network metrics such as throughput, application protocols
- Top X talkers/listeners, top ASs, top L7 applications.
- For each communication flow report network/application latency/RTT, TCP stats (retransmissions, packets OOO, packet lost), bytes/packets
- Store on disk persistent traffic statistics in RRD format.
- Geolocate hosts and display reports according to host location.
- Discover application protocols by leveraging on nDPI, ntop’s DPI framework.
- Characterise HTTP traffic by leveraging on characterisation services provided by Google and HTTP Blacklist.
- Show IP traffic distribution among the various protocols.
- Analyse the IP traffic and sort it according to the source/destination.
- Display the IP Traffic Subnet matrix (who’s talking to who?)
- Report IP protocol usage sorted by protocol type.
- Produce HTML5/AJAX network traffic statistics.
How to Install and Configure Ntop to Monitor Network in Ubuntu
Here is the installation guide for Ntopng for Ubuntu 14.04 server. The packages for ntopng can be found at http://packages.ntop.org/ . Select either the “nightly” or “stable” builds. For more reliable versions, you should choose the stable one. Execute the following two commands on the server to add the repository of ntopng:
wget http://apt-stable.ntop.org/14.04/all/apt-ntop-stable.deb
sudo dpkg -i apt-ntop-stable.deb
Now you can install ntopng with:
sudo apt-get update
sudo apt-get install ntopng
This will install a bunch of packages, incuding ntopng, ntopng-data, pfring, redis-server, redis-tools.
Before you can start ntopng, you need to create a configuration file:
sudo nano /etc/ntopng/ntopng.conf
The following configuration values can be used as a starting point:
--pid-path=/var/tmp/ntopng.pid
--daemon
--interface=eth1
--http-port=3000
--local-networks="192.168.0.0/16"
--dns-mode=1
--data-dir=/var/tmp/ntopng
--disable-autologout
--community
(There can be more than one “–interface=ethX” lines in this config file if several interfaces are used in parallel.)
To see all available interfaces and options, use the ntopng -h option:
sudo ntopng-h
Now you can start ntopng with:
sudo service ntopng start
It will also started automatically after a reboot.
Now you can test your ntopng application by typing http://yourserver.name:3000. You will see ntopng login page.

For the first time, your default credentials are user ‘admin’ and password ‘admin’. Once you login, you will see the dashboard with a glance of real traffic on your network.
Click on the Host option to see the traffic and details of all the active hosts on your network.
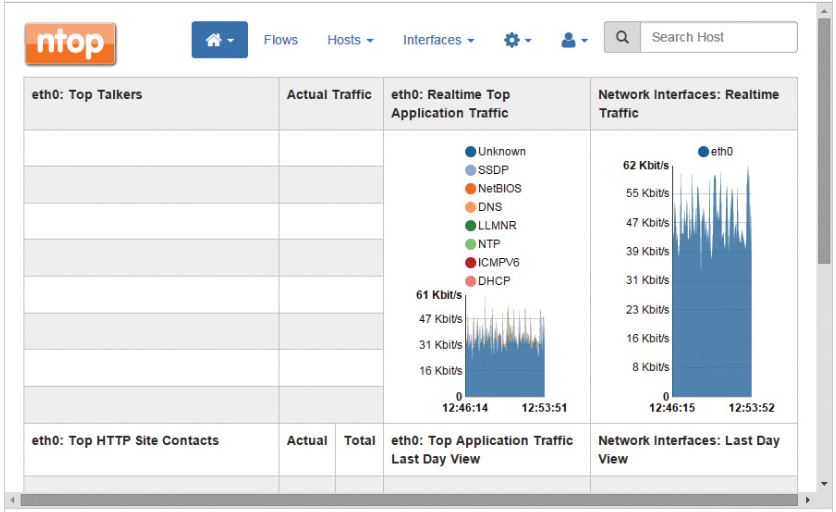
You also get the graphical representation of traffic flow, hosts, ports, and applications and can monitor your network bandwidth consumption in a graphical way.
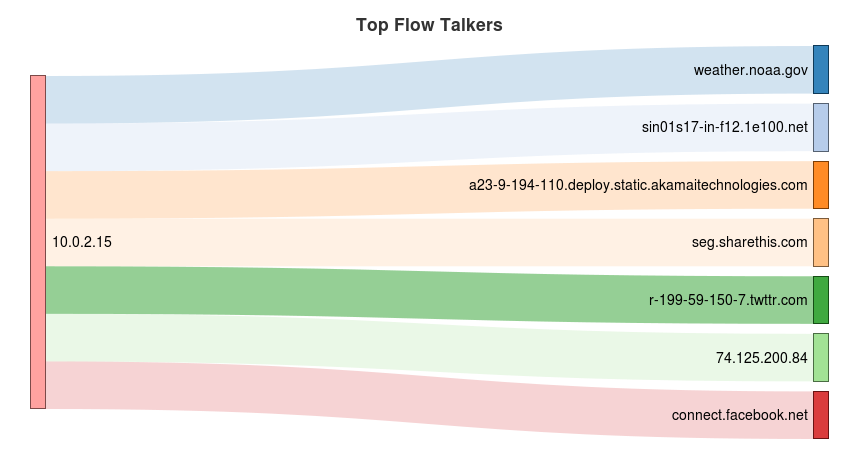
Top Flow Talkers
This will show information regarding heaviest traffic patterns and most-used applications in the network.
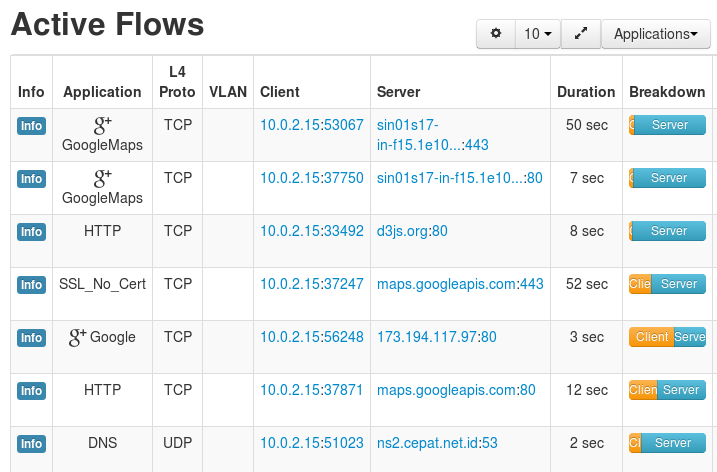
Active Flows
It will show the currently active Application flows.
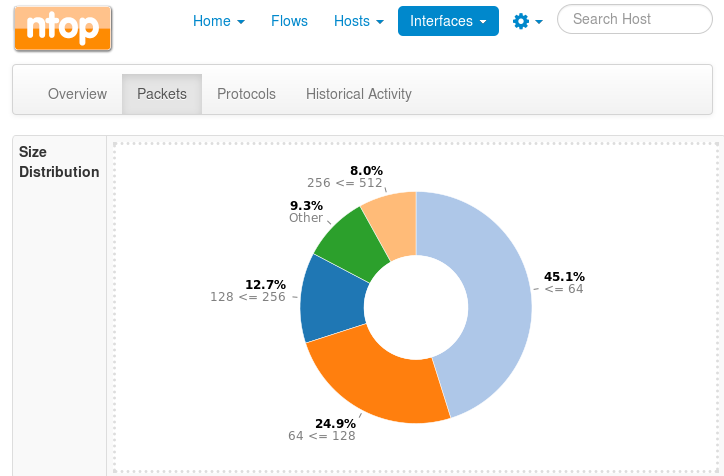
Interfaces menu will bring you more menus inside. Packets menu shows you size distribution of packets.
Protocols menus will give you information about how many protocols that have been used and its percentage.
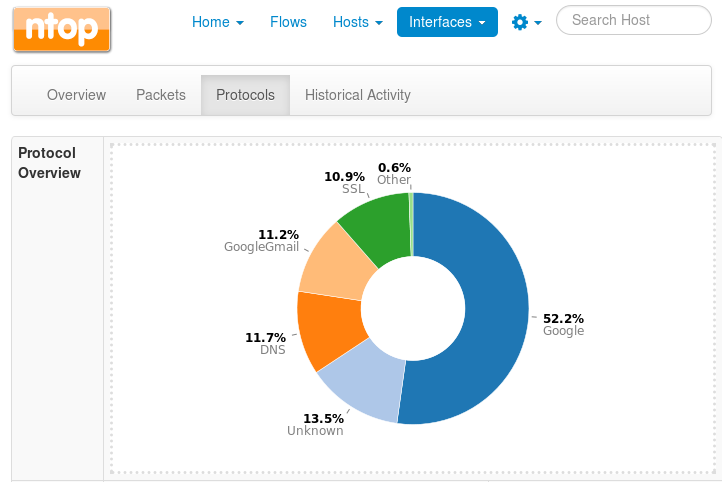
Protocol details:

Historical Activity menu
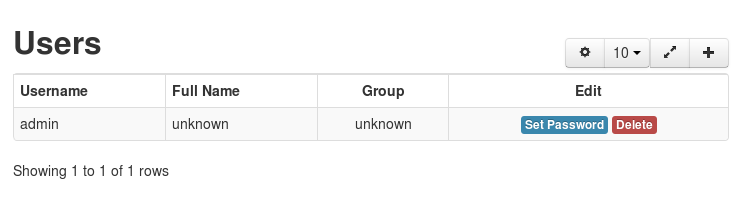
Users can manage user settings to access ntopng via Settings menu > Manage Users
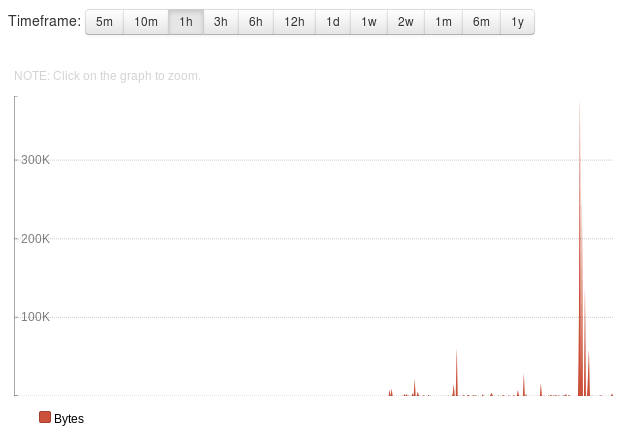
Ntopng provide timeframe, from every 5 minutes until 1 year to view the status. You just need to click the timeframe you want to show.
You can also integrate it with GeoLocation and GeoMap services. From ntopng website itself, there is a paid module such as nprobe to enrich the information provided by ntopng. For more details of ntopng, please visit ntopng website